ViniyogIndia 🚀 Momentum Portfolio invests in a basket of strongly trending Stocks & ETFs. This portfolio is suitable for Aggressive investors.
Momentum Investing Strategy Basics
The basic idea of momentum investing is intuitive. A stock or any other asset, that has been trending strongly for a while is likely to continue doing so a little while longer. That is the core concept, rest are details.
Nobel Laurette economist Eugene Fama, who propounded the Efficient Market Hypothesis (EMH), described momentum as a “premier anomaly” and termed it a “pervasive” phenomenon. EMH states that as markets are efficient, therefore, past prices cannot predict future returns. Momentum strategies do exactly that, and has been doing so for more than 100 years.
There is no universal explanation as to why price momentum works. Potential explanations include investors tendency to initially under-react, and then over-react to news affecting stock prices – a behavioral bias often described as initial under-reaction and delayed over-reaction.
Momentum remains an extensively researched subject in finance which papers documenting evidence of momentum in stock prices dating almost a century back.
- Momentum Investing Strategy Basics
- Stocks & Weights
- Academic research on Momentum Investing Strategy
- Momentum investing research in India
- ViniyogIndia 🚀 Momentum Investing portfolio
- Historical performance of ViniyogIndia 🚀 Momentum portfolio
- Performance measurement & attribution analysis of ViniyogIndia 🚀 Momentum Portfolio
- Subscribe to this portfolio:
- Credits
Stocks & Weights
🔐 Please log in to access the latest recommendations.
Academic research on Momentum Investing Strategy
Seminal research by Jegadeesh & Titman
Using data from 1965 through 1989 they observed that winning stocks on the NYSE & AMEX over past 6 to 12 months continued to outperform losing stocks on average over next 6 to 12 months by approximately 1% per month.
Following this paper, their findings have been separately confirmed by many other academic studies, some even going back to the 19th century.

Narshiman Jegadeesh was an IIT/IIM graduate who earned his PhD at Columbia University.
In 1993, Jegadeesh, along with Sheridan Titman (UCLA) published a study showing that intermediate term momentum can be used to generate excess portfolio returns. This paper was described as a “bombshell” against those who glorified the Efficient Market theory.
(Narshimhan Jegadeesh, left, with Sheridan Titman)
52 week High-Low strategy
Using data from January 1963 to December 2001 they showed that the long-short portfolio generates 0.45% excess returns per month, with the winner’s portfolio averaging 1.51%, about 50% more than the loser’s portfolio average return of 1.06%.
Momentum is Persistent and Pervasive
Geczy and Samonov (2012) showed that momentum has worked for US equities for 212 years all the way back to 1801!
Multiple researchers [Antonacci (2012), Asness (2013), King, Silver & Guo (2002)] have established that momentum works over a dozen asset classes and more than 40 countries.
No wonder, Fama & French dscribed momentum as a “premier anomaly” and a “pervasive” phenomenon.
The premier market anomaly is momentum… It has been the biggest embarrassment to the Efficient Market theory and I hope it goes away! 🙂
Eugene Fama
Nobel Laurette Economist for Efficient Market Hypothesis (EMH)
Dual Momentum Investing
Between 1974 & 2013, GEM returned 17.43% annually, compared to 12.34% for S&P500 and 8.85% for ACWI.
Momentum investing research in India
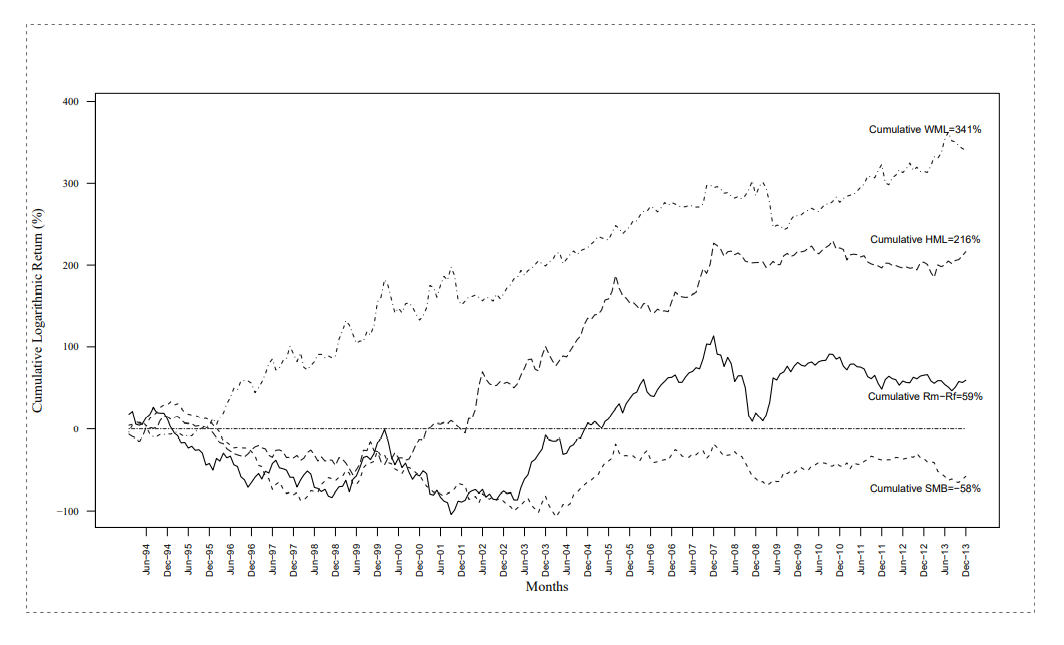
Based on this study, the average annual return of the momentum factor was 21.9%; the average annual return on the value portfolio (HML) was 15.3%; that of the size factor (SMB) nearly 0%; and the average annual excess return on the market factor (MRP) was 11.5%. You can read more on Factor Investing here.

Cumulative log-returns of four factors in India, adjusted for survivorship bias. Results suggest that the momentum earns significant positive returns (cumulative return of 341%) in the Indian market.
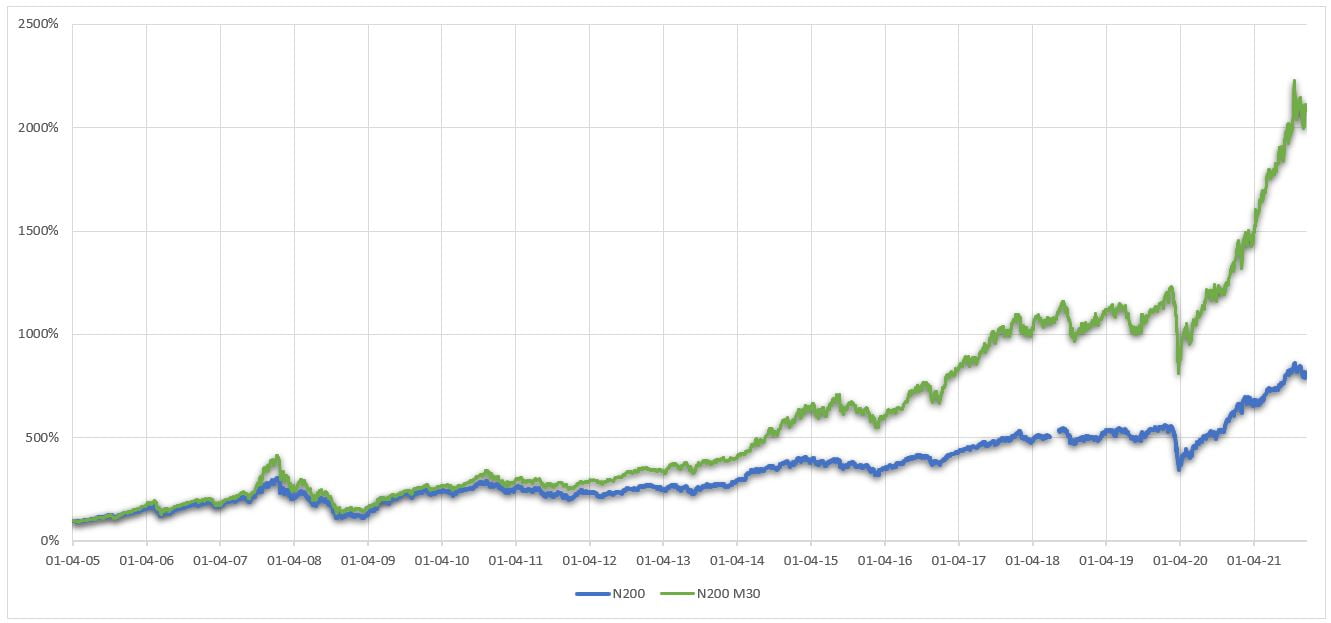
The Nifty200 Momentum 30 Index
This index has significantly outperformed the benchmark returning 18.6% annualized since inception against 12.7% for its parent.

ViniyogIndia 🚀 Momentum Investing portfolio
- Portfolio of top 20-25 stocks picked from the NSE universe demonstrating strong uptrend
- Further refined using combination of secondary factors to maximize risk adjusted returns
- Mathematical model to control market exposure for risk management
- Illiquidity filter to remove low volume/ turnover stocks
- Rebalanced once a month in order to keep % turnover low
Performance measurement & attribution analysis of ViniyogIndia 🚀 Momentum Portfolio
| Alpha | MKT | SMB | HML | WML | |
|---|---|---|---|---|---|
| Factor exposure | 0.856 | 0.656 | 0.107 | 0.145 | 0.394 |
| p-value | 0.003 | ~0.0 | 0.11 | 0.018 | ~0.0 |
Monthly alpha or excess return for the strategy is 0.856%. This is generated using a combination of secondary factors and asset allocation strategies that tries to enhance momentum returns while reducing risks.
Additionally, standard factors, such market beta, momentum and value also add to the overall strategy returns. Returns from the size factor isn’t statistically significant.
It is important for the investors to understand the sources of return for their funds in order to appreciate the value provided by the fund manager, as in many cases managers fail to generate alpha despite charging hefty fees. What they generate instead are betas, which can be easily obtained by exposure to the standard risk factors.
In such cases where an analysis of the fund’s performance reveal that the manager isn’t generating any alpha, investors would be better off buying low cost index funds or ETFs which provide exposure to one or more of the betas such as value, momentum or size. In case of momentum for example, one such low cost fund is the UTI Nifty200 Momentum 30 Index Fund whcih basically mimics the Nify200 Momentum30 Index.
Subscribe to this portfolio:
Fixed Fee:
Rs. 5499 3999/ 6 months.
Asset Based:
1.8% yearly. Offered as smallcase


