

If a poll was taken asking investors to name the greatest investor of all time, it is safe to assume that the vast majority would say “Warren Buffett”.
For years people have tried to figure out Buffet’s methods, hoping to replicate his investment success. So, what is Buffet’s “secret sauce”?
In this article, we try to find out!
We also explain how at ViniyogIndia.com, we use the same concepts to design our Core Investment Portfolios.
But before we begin, let’s take a step back and look at the factors that make stock prices go up.
Asset Pricing Models & Factors
Over the years, academic community have tried to come up with various models trying to explain asset returns. These models, or asset pricing models as they are usually called, describe expected returns of financial assets, such as stocks, bonds, etc. using various characteristics or factors.
Simply put, factor can be considered as a quantitative representation of a qualitative theme that can be used to explain asset returns.
Capital Asset Pricing Model (CAPM)
An example is the Capital Asset Pricing Model or CAPM. In simple terms, it says, returns of an individual stock (or any other financial asset for that matter), is related to market returns. So if the market goes up, stocks in your portfolio are likely to go up (& vice versa) assuming a positive correlation.
This relationship is quantified by the following equation known as CAPM, which says expected return of an asset is Risk Free Rate, plus a constant times market risk premium (expected market returns minus risk free rate). This is constant or beta here is called the Market Risk Factor.
Ri = Rf +βi(Rm – Rf)
Fama-French Three Factor Model plus Carhart’s Momentum Factor
Despite its popularity, CAPM is simplistic and is often criticized for its inability of explain asset returns based on empirical data. In particular, multiple studies indicate that value stocks and small cap stocks tend to outperform growth and large cap stocks respectively.
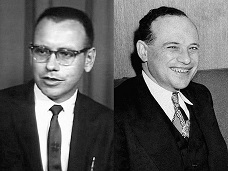
(Ben Graham, right, with young Warren Buffett)
Foremost amongst these studies was the 1930s classic Security Analysis written by Buffet’s teachers Graham & Dodd almost 3 decades prior to publication of CAPM. This book had already laid the intellectual foundation for value investing.
These anomalies led Kenneth French and Eugene Fama to come up with a 3 Factor model that had Value and Size as two additional factors.
Ri – Rf =αi +βi,m(Rm – Rf) + βi,SMB(SMB) + βi,HML(HML) + εi
In 1993, an IIT+IIM grad (& later Columbia University doc) named Narshiman Jegadeesh, along with Sheridan Titman (UCLA) published a seminal study showing that intermediate term momentum can be used to generate excess portfolio returns. Following their paper, which was described as a bombshell, and subsequent research, Mark Carhart expanded the model further by adding momentum as a fourth factor (1997).
(Narshimhan Jegadeesh, left, with Sheridan Titman)

Carhart’s Four Factor Model in regression form is represented as:
Ri – Rf =αi +βi,m(Rm – Rf) + βi,SMB(SMB) + βi,HML(HML) + βi,WML(WML) + εi
Factor Zoo
Subsequently, many more factors have been identified to explain asset returns and newer factors are getting discovered by academia and industry alike.
For example, a paper published in 2014, examined 600 such factors from academic and practitioner literature. Another paper in 2015, reported 59 new factors discovered between 2010 and 2012 alone. So much so, that the situation of rapidly expanding factors led to coining of the term Zoo of factors.
Buffet’s Secret Sauce
With this context in mind, lets return to our original question – what is Warren Buffet’s secret sauce?
A 2013 study titled “Buffett’s Alpha,” provides an interesting perspective.
The study says that Buffett’s success can be explained purely in terms of exposure to factors, and not by any unique stock-picking skills.
Once all the factors described in the study — namely, market beta, size, value, momentum, betting against beta (a strategy that takes leveraged long positions in low-beta assets and short positions in high-beta assets), quality, and leverage — are accounted for, a large part of Buffett’s performance is explained, and his alpha becomes statistically insignificant!
Perhaps Po, the panda and Mr. Ping, the duck, was right all along – there is no secret ingredient!!
On a different note, the movie ‘Kung-Fu Panda’ was so successful in China that it caused a national debate on why Westerners made a better film about Chinese culture than the Chinese themselves.
Be it Taosim or Yoga, Americans are rediscovering and repackaging ancient Asian concepts (of existing in harmony with the universe) better than us, while we, in particular the Indians, continue to ape the west.
Back to the topic, these findings however, does not in any way detract from the genius of the Buffets & Grahams of the world. Their genius lies in recognizing and applying the concepts of factor investing long ago, decades before modern financial theory could catch up.
Factor Investing in Indian Markets
So, how well does factor investing work in India?
Below chart summarize Risk/Return Characteristics of Single-Factor Indices and Portfolios in Indian markets between October 2005 to June 2017.
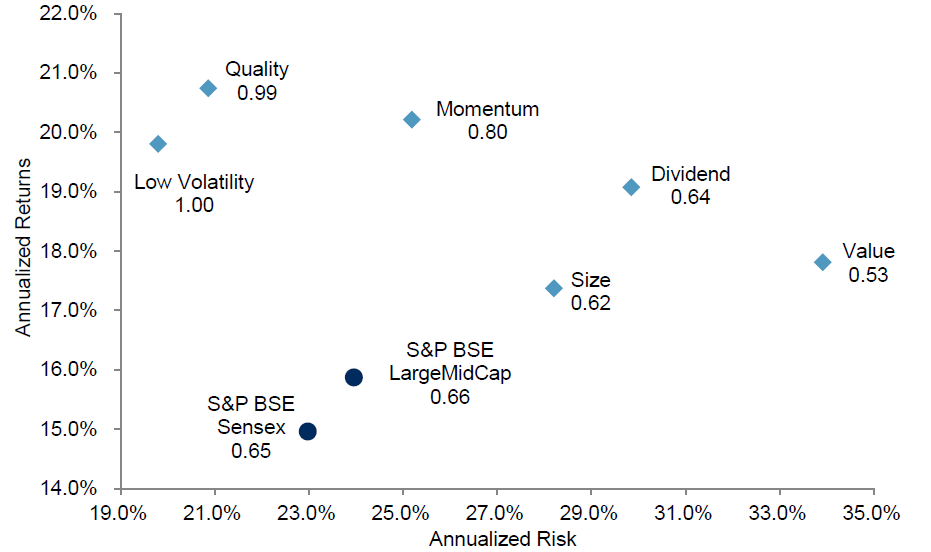
Over the period from October 2005 to June 2017, portfolios for all factors, (low volatility, momentum, value, quality, dividend, and size) outperformed the S&P BSE LargeMidCap.
However, only low volatility, quality, and momentum delivered better risk-adjusted return (return per unit of risk) than the S&P BSE LargeMidCap.
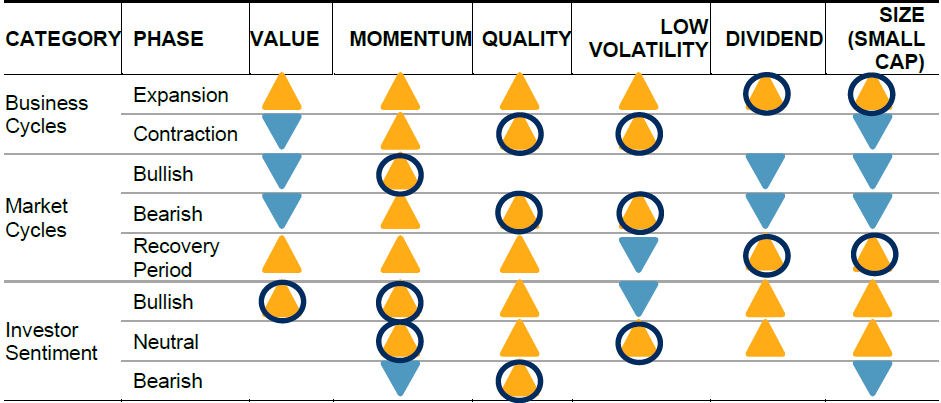
Factor Performance is Cyclical
Macroeconomic and market events affected each factor in different ways.
No single factor works all the time, instead, they are found to exhibit cyclicality with periods of outperformance and underperformance in different phases of the cycles.
Understanding the cyclical characteristic of factors across different macroeconomic regimes is vital for implementation of factor strategies.
Below chart summarizes performance characteristics of factors in different macroeconomic regimes, including market cycles, business cycles, and investor sentiment regimes in India
Multifactor portfolios
While single factor portfolios can beat the market over long term, they are also likely to underperform over short /medium term due to factor cyclicality.
As an alternative, single factors could be blended into multifactor portfolios that aim to deliver smoother excess return across business and market cycles.
This is what we try to do in our Core Multifactor Portfolios.