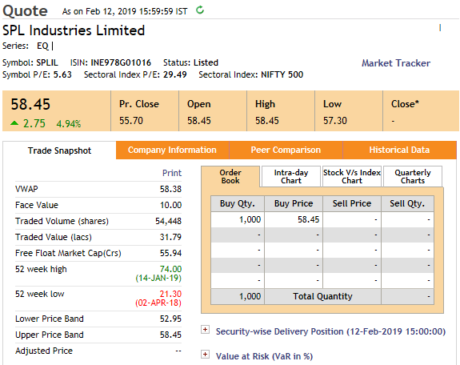
In September 2017, SPL Industries, a garment manufacturer and exporter, exited manufacturing business, rented out its facilities to group entity that was already into manufacturing, and moved entirely into trading & export of garments. From the following quarter Q3FY18 onwards, its operating margins jumped and stayed above 17.5% from around 4-5% earlier. Subsequently, between Q4FY18 and Q2FY19, promoters quietly increased their stake by almost 1.5%. Market did not notice it for almost a year. Then in August 2018, the stock suddenly jumped by over 100% in two weeks. In a year when small-caps have been butchered by 50% or so, SPIL has returned around 120%. This prompted us to take a closer look at the story.
Company Overview
SPL Industries Ltd was originally incorporated as Shivalik Prints Private Limited on December 6, 1991 in New Delhi. The name of the Company was subsequently changed to SPL Industries Ltd in 1994.
Later in 1998, a company with the name Shivalik Prints Limited, was incorporated on August 1998. Shivalik Prints is managed by relatives of SPL directors and the company is invested in SPL (0.52%) as of end FY18.
SPL is promoted by Mr. Vijay Jindal who has more than 2 decade of experience in the apparel industry. Further, the chairman and managing director of the company Mr. Mukesh Aggarwal; has been associated with the company since its inception has approximately 22 years of expertise in this field.
Principal business activity
The Company is an export house of garments. In FY 2017-18 the ratio of export & domestic sale of garments was 96.07:3.93. (AR FY18 P-24)
The company is engaged in trading of garments and job work (stitching and dying) for Shivalik Prints Limited. In FY18, SPL has enhanced its job work capacity from 7200 MTPA to 9000 MTPA in order to meet higher demand in future from Shivalik Prints which has resulted in higher operating income from it with Rs. 56.28 cr being generated in FY18 as compared to Rs. 37.27 cr in FY17. The cost of the project was ~Rs. 4 cr.
Till Aug’17, the company was primarily engaged in the manufacturing of garments; however, due to the changing customer requirement and comply with the environment regulations, the company was required to incur capital expenditure of ~Rs. 10-15 cr. At the same time, the other group company, namely, Shivalik Prints Limited was engaged in manufacturing of garments with latest machinery and had its manufacturing facilities near to SPL. Therefore, considering the synergies between the two companies, SPL decided to discontinue the manufacturing segment and start with the procurement of the readymade garments from Shivalik. SPL has given its existing manufacturing facilities on rent to Shivalik at monthly rental of Rs. 0.10 cr. Now, the company procures the garments from Shivalik Prints Limited and sells it to its customers.
Key clients
SPL exports its products to various international retail chains and super stores, predominantly in USA, Europe, Canada and Japan. The majority of sales are driven by few clients with top 7 clients constituting over 51% of the total net sales in FY18 indicating high client concentration risk. The top 2 client viz. Shinsegae International and The Children Place “TCP” constituted ~35% of the total net sales in FY18 (~29% in FY17).
Plant locations
SPL has a total production capacity of 9000 Metric Tonne (M.T.) per annum. The company has 2 manufacturing facilities situated in Faridabad, Haryana and has a total production capacity of 60 lakh pieces per annum. From Sep’17, the company has stopped manufacturing and has moved into trading of garments.
Marketing & distribution
Competitors
Industry attributes
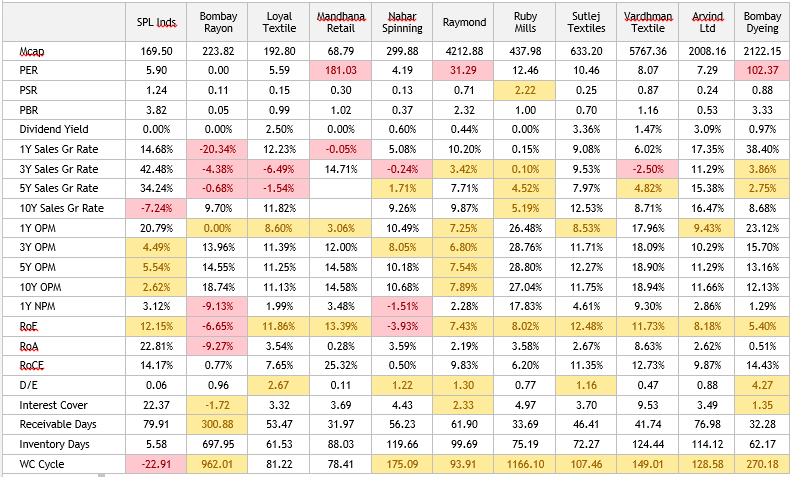
As can be observed from the table above, biggest challenge facing the industry is flattish sales. Sales growth has been muted for the past 3-5 years across the industry and all companies have been impacted.
Except for Arvind Ltd., no other company clocked double digit top-line growth consistently.
In terms of margins, Ruby Mills has by far the best margins, followed by Vardhman. With the exception of SPL & Raymond, majority of the companies have been consistently clocking double digit margins.
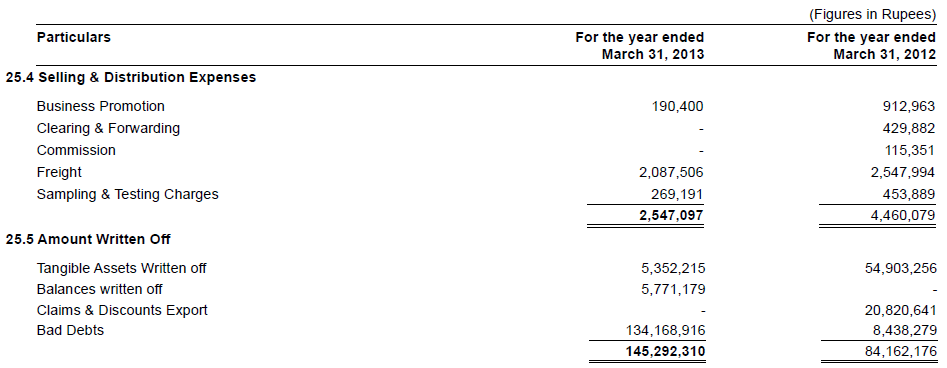
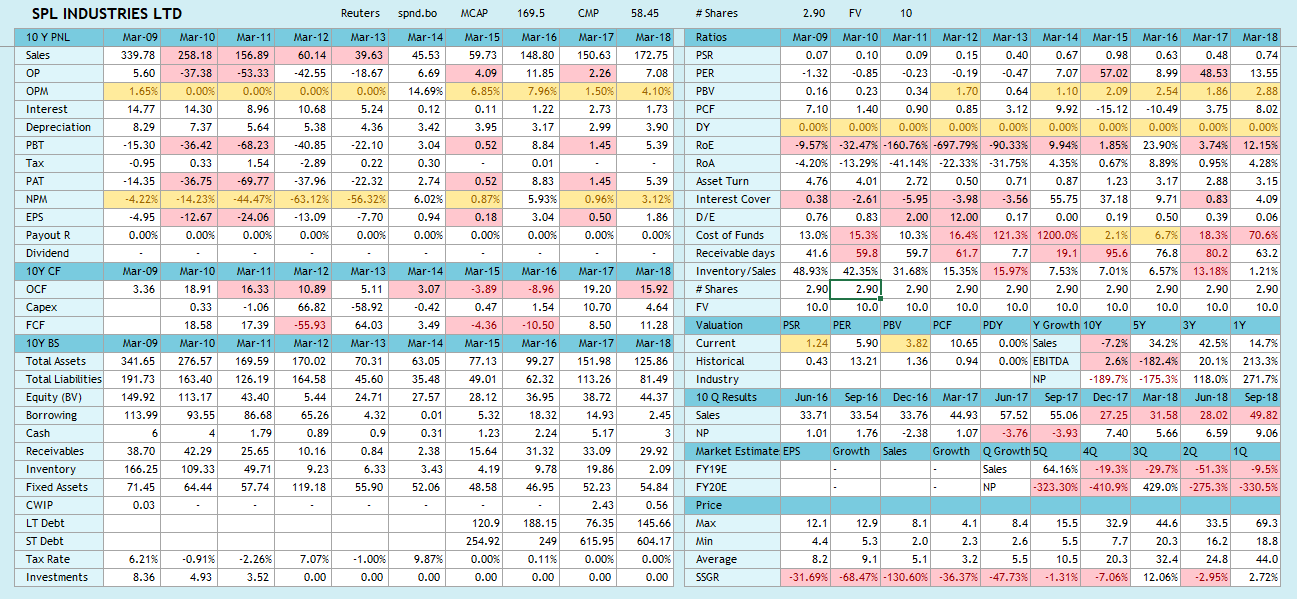
SPL has a negative 10Y growth, and historically one of the worst margins. Between FY09 to FY13, SPL consistently made losses, with frequent write-offs in the P&L.
In 2013, SPL became a part of SPL group. Post the takeover by SPL group; the management commenced the process of company’s revival and did a capital expenditure of around Rs. 12 cr over two years to increase the installed capacity of garmenting division to 60 lakh pcs per annum in FY17 as against 2.5 lakh pcs per annum in FY15.
Further, with increase in installed capacity, the utilization levels have also increased from 89% in FY16 to 99% in FY17 indicating improved operating performance.
From Sep’17, the company stopped manufacturing, rented out its manufacturing facilities to group company Shiwalik Prints Ltd and moved into trading of garments.
Consequently, inventory days improved to below 6.
OPM also jumped to over 20% TTM from 4-5% before Q3FY18 onwards. OPM have sustained above 17.5% for the past 5 quarters
If SPLIL is able to maintain strong top-line growth momentum, then the growth combined with significant improvement in OPM and low valuation will make an interesting combination.
However, how this significant improvement in OPM came about isn’t clear (at least, to me)
Shiwalik Prints isn’t a related entity of SPLIL, hence company isn’t obliged to disclose its numbers.
Concern is, is the improvement is OPM due to synergies, or is it due to shifting the issues to a different separate black box entity?
Shareholding
Promoter holding & recent changes
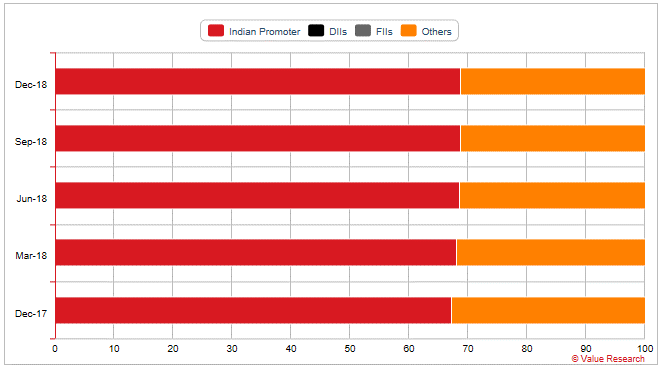
Indian promoters hold 68.73% as of December 2018, up from 67.24% a year back. Promoters added 1.49% shares in past one year.
As of FY15, promoters held 67.24% shares. There was no change in promoter holding between FY15 and FY17. Only in the last one year, promoters have increase stake by around 1.5%.
More than 1% shareholders
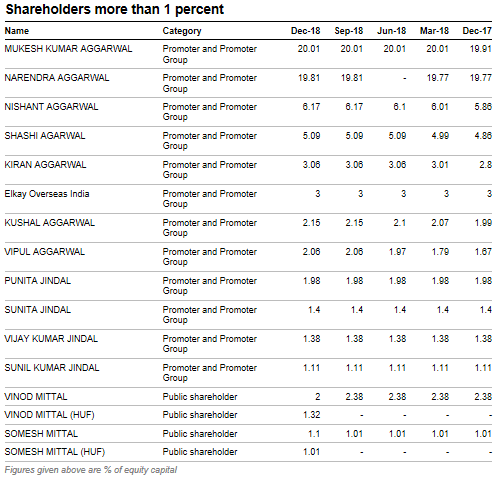
4 entities with surnames Mittal hold around 5.43% stake. They added 2.33% in December quarter.
Also, Shivalik Prints is managed by relatives of SPL directors and the company holds (0.52%) stake as of end FY18.
Indirectly related shareholders
Shivalik Prints (0.52%)
Shares pledged
None.
Management Analysis
Directors
Shashi Agarwal is the wife of Mukesh Agarwal. Vijay Jindal is Mukesh’s cousin brother.
Remuneration
Managerial Remunerations have often exceeded ceiling set by Companies Act, due to low PAT. Salary as such is not very high
Related Party Transactions
SPL have taken significant portion of its loans from related parties in past. However the borrowing rates have been reasonable. Credit rating agency CARE also acknowledged the same in its December FY18 credit note.
Employee Feedback
Employee feedback for the group is positive, although the sample size is small, hence reliability could be a question.
Shivalik Prints also has a rating of 4.2 based on 4 reviews and the feedback is very good.
Financials
10Y historical financials
Growth rates
SPLIL has a negative annual growth over past 10 years. However, after becoming part of SPL group in 2017, company has been growing rapidly
Cash Flow
SPLIL has positive FCF over past 5 years as well as 10 years.
Profitability
Company used to enjoy OPM of around 6-7% on average. Since its migration to trading from manufacturing in FY17, SPIL’s OPM has increased to over 17.5%
Leverage & Liquidity, debt outlook
SPLIL has D/E of 0.06. Receivable days have fallen to around 2 months. Interest cover is over 4.
Cost analysis
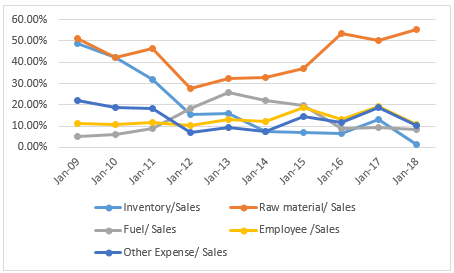
Inventory cost as a percentage of sales had significantly come down from 50% in FY09 to below 2% in FY18. Raw material cost however has been going up.
Contingent Liabilities
Contingent liabilities are potential cash outflows contingent to a future event. Large contingent liabilities can be risk to future profitability of a company.
As of end FY18, contingent liabilities are around 6 cr, mostly tax disputes, including appeals which appears to be reasonable.
Tax rates & benefits if any
Average tax rates have been around 2% for both past 5 and 10 years.
AR FY18 states the following:
In way of the brought forward losses and unabsorbed depreciation as per the management no tax is payable during the year both under normal provision of the income tax act 1961 & under section 115JB of the income tax act 1961.
Cash + Investments
Companies often invest in unrelated assets such as private entities owned by the promoters which are of no benefit to the company or minority shareholders, but beneficial to promoters.
In case of SPLIL, liquid assets are mostly in terms of cash as of FY18 which should be fine.
Cash + Investments as % of assets
Auditors comments
Statutory Auditors: M/s Singhi Chugh & Kumar, Chartered Accountants
No material negatives in the auditor’s report.
Credit rating
Current ratings
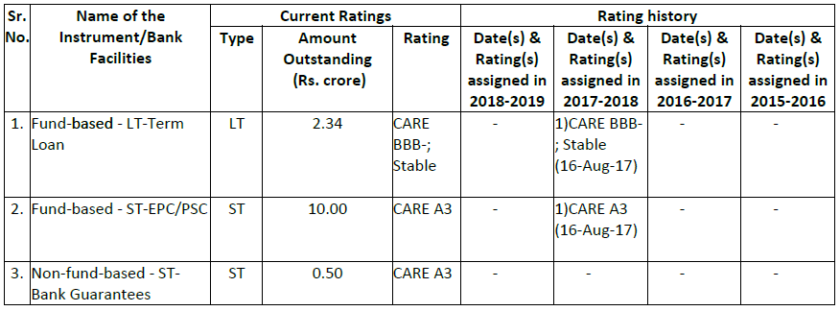
CARE credit rating as of October 2018 are as follows:
Historical change in ratings
Rating history has been steady
Subsidiaries, Associates & JVs
SPL Industries does not have any subsidiaries, associates or JVs.
Valuation, earnings estimates
Relative valuations
SPLIL is available at PER of 5.9, PSR of 1.24, PBV of 3.82, DY of 0%. Company is trading below historical PER of 13.21 and above historical PSR of 0.43. SPLIL did not pay dividends in the past 5 years.
Form industry perspective, SPLIL is expensive compared to peers w.r.t to PSR, PBV and DY metrics. PER is lower than average, but that could be more due to its smaller market cap and sudden surge in margins. Valuations for the industry in general is currently subdued.
On a relative basis, SPLIL is not cheap compared to its peers.
Risk Analysis
Forex Risk
The company is predominantly export oriented with total export accounting for major part of the production in FY18. Though, SPL hedges around 60% of its exports receivable through forward contracts still around 40% remains unhedged, exposing it to appreciation in the value of rupee against foreign currency which may impact its cash accruals. During FY18, the company reported an income of Rs. 2.00 cr (PY: Rs. 0.17 cr) from foreign exchange fluctuation.
Client concentration risk
SPL exports its products to various international retail chains and super stores, predominantly in USA, Europe, Canada and Japan. The majority of sales are driven by few clients with top 7 clients constituting over 51% of the total net sales in FY18 indicating high client concentration risk. The top 2 client viz. Shinsegae International and The Children Place “TCP” constituted ~35% of the total net sales in FY18 (~29% in FY17). However, as the company has established strong relationship with its clients over the years; the client concentration risk has been mitigated to a large extent.
Fragmented and competitive nature of the garment industry
The readymade garment industry is highly fragmented and is characterized by low entry barriers as it is the least capital intensive part of the textiles value chain. There are more than 8,000 exporters registered with Apparel Export Promotion Council (AEPC).
The Indian textiles industry, currently estimated at around US$ 120 billion, is expected to reach US$ 230 billion by 2020. The growth would primarily be driven by the increasing shift of the apparel industry from the developed western nations (traditional exporting destinations) to the other non-traditional markets. Currently, India’s exports are mainly directed to the traditional markets – US and EU and now, with these regions turning into matured markets, the growth in apparel imports is expected to slow down. The Indian textiles industry is currently facing challenges in the form of currency risk, increasing competition from China on unfavourable currency and higher raw material costs. However, India is well poised to gain from long-term growth in the global home textiles market, as it leverages the twin benefits of lower cost of production and significant share of global installed capacity. Abundant raw material availability, a well-integrated textile industry and good designing skills are the key attributes, which if utilized in an efficient way, can help India to consolidate and grow its position in the global apparel market.
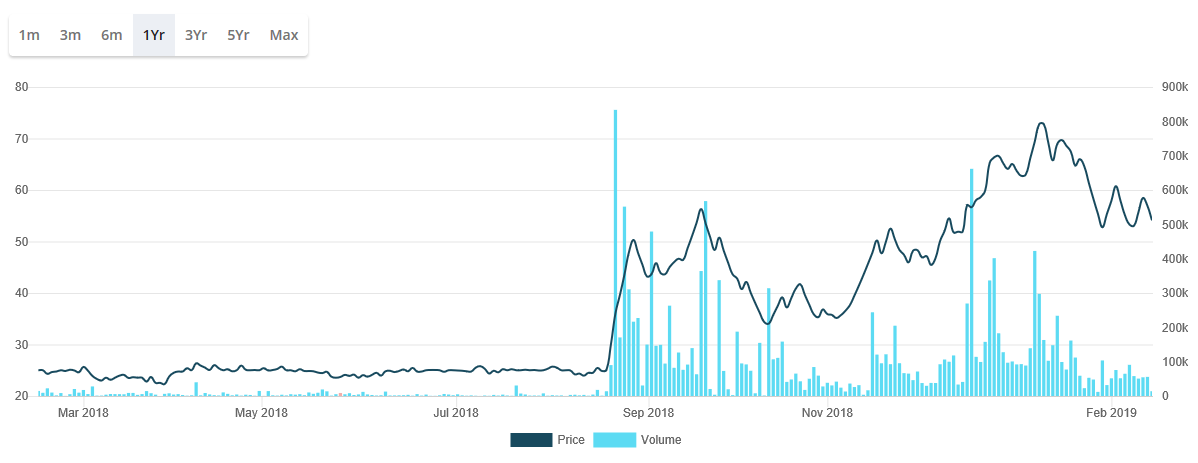
One year historical price chart
RSI, momentum
Momentum score is 57/100 (amber)
Free float, liquidity
Free float is 56 crores.
Stock has hit 2 upper circuits and 2 lower circuits in 4 of the past 7 days
Non-promoter / public hold another 8.88% shares, in addition to 68.73% in December, 2018. Stock is fairly illiquid, with the scrip touching circuits when the trade volume for the day was < 32L.
Conclusion
SPLIL used to be a loss making garments manufacturer and exporter that turned around in 2013 when it became part of the group. The group ramped up capacities, increased production and made the company profitable.
In 2017 SPLIL discontinued manufacturing and focussed completely into trading. This saw its margin jump to over 17.5%. From a company that was continuously making losses until 2013, transformation to one of the most profitable garment exporters in the industry is a significant achievement.
This becomes even more striking considering the fact that company does not manufacture in-house, outsources production to group entity, which at arms-length should ideally led to a margin erosion.
Primary clients of SPLIL are chains and superstores located primarily in US and Europe which have significant bargaining power. This is evident from continuous streak of losses until FY13 and low margins even after turnaround until FY18. This makes the sudden spike in margin even more difficult to understand.
SPIL’s website hasn’t been updated for years, Annual Reports are sketchy and the management does not hold analyst meets to our knowledge. In view of this, it’s challenging for small investors to understand the nature of efficiencies and levers that led to this significant improvement in profitability.
SPIL’s supplier is Shivalik Prints which is a private group entity. Any disruptions in suppliers business will disrupt SPLIL’s operation. However, Shivalik isn’t a subsidiary or a related party by definition, (even though its run by relatives), consequently, not obliged to disclose its numbers and operational details.
This kind of setup, where entities directly or indirectly held by relatives are privately operating a similar or related business have often been used as vehicles by promoters to commit fraud, and or manipulate share prices of the listed entity. However, there is no evidence as of now to suggest that SPIL is engaged in any such activities.
On the positive side, publicly available data suggest that the the company has decent cash-flows, insignificant leverage, decent liquidity, strong margins and good employee feedback. Promoters increasing stake in the past 1 year along with strong price performance in a weak market are added positives.
Even with all these positives, investors should perform a careful and thorough research before investing. The stock is extremely illiquid, with price touching circuits on 4 out of past 7 days. In case of any negative developments it will be extremely difficult to find an exit.


