

ViniyogIndia Chameleon portfolio offers an adaptive multifactor basket of stocks where the factor exposures are dynamically realigned based on changing market conditions. This portfolio is suitable for Moderately Aggressive investors.
ViniyogIndia offers model portfolios based on Quantitative Factor Investing strategy. Factors are quantitative attributes that can be used to explain asset returns.
Mathematically, if we try to model Asset Pricing behavior as a liner multivariate function, then factors represent the independent or explanatory variables of the function.
Factor strategies have been extensively researched globally as well as in India. The below chart for example, summarizes the risk-return characteristics of single-factor portfolios in India between October 2005 and June 2017. Over the period, all major single-factor portfolios outperformed the S&P LargeMidCap.
ViniyogIndia’s factor portfolios use a combination of factors that are proven to work well in the Indian markets.
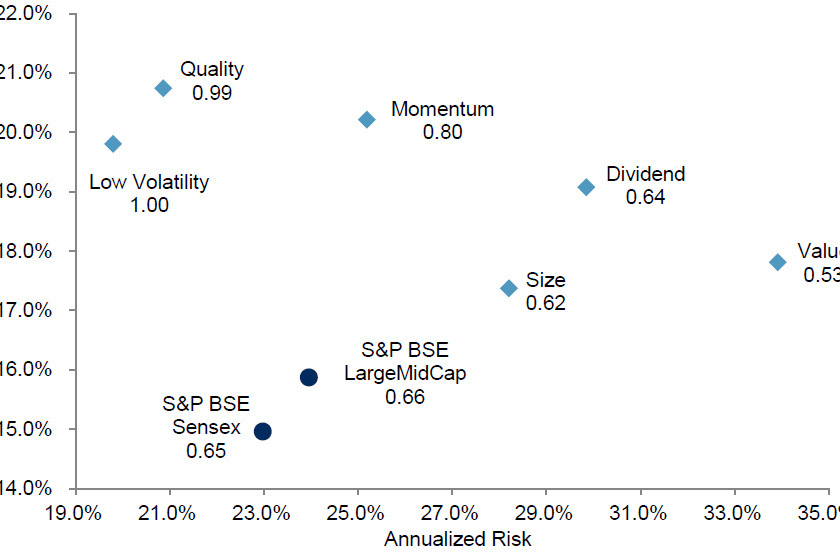
Source: S&P Dow Jones Indices LLC. Data from October 2005 to June 2017. Index performance based on total return in INR. Past performance is no guarantee of future results
Portfolio Design Rules
Factor performance is cyclical. Consequently, single factor portfolios can underperform market benchmarks in the medium term. ViniyogIndia Chameleon Portfolio addresses this problem by continuously realigning portfolio exposure towards the best performing factor mix.
- Portfolio of approximately 20 stocks and ETFs selected from the NSE universe.
- Stocks are ranked by factor exposures; the top 20 stocks with highest exposure to the best performing factor blend are chosen.
- Liquidity filter to remove low volume | turnover stocks.
- Rebalanced quarterly to keep the portfolio churn low.
Risk Management Rules
Risk exposure to the overall portfolio is contained by:
- Limiting exposure to any single stock or sector
- Conservative nature of the factor combination used to reduce downside risks.
Suitability
This portfolio is suitable for moderately aggressive investors.
Performance measurement & attribution
To interpret the sources of return for our strategy we perform a regression analysis using Carhart 4 Factor Model. The results are shown in the table below:
| ALPHA | MKT | SMB | HML | WML |
|---|---|---|---|---|
| 2.05 | 1.05 | 0.64 | 0.28 | 0.37 |
| ~0.0 | ~0.0 | ~0.0 | 0.0002 | ~0.0 |
The monthly alpha or excess return for the strategy is 2.05%. This is generated using a combination of secondary factors and factor rotation rules that tries to enhance portfolio returns while reducing risks.
Additionally, exposure to standard factors such as market beta, size, value and momentum also contribute to the overall portfolio returns.
Sector Allocation
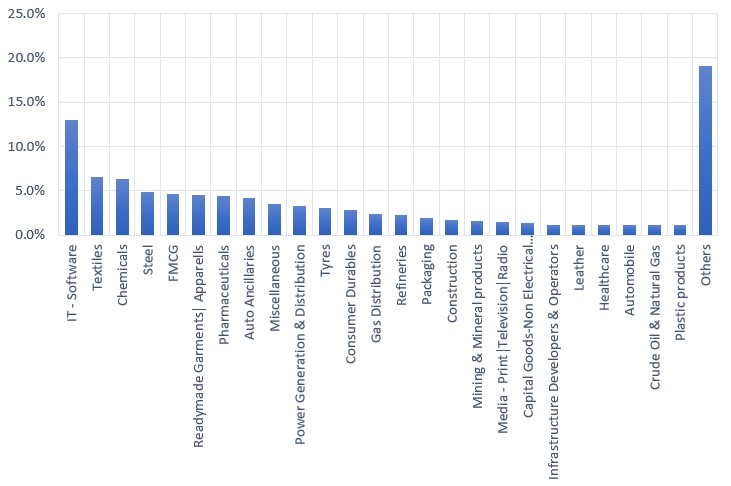
Historical sector allocation of the strategy shows adequate diversification. Analysis of historical sector allocation also shows greater allocation towards conservative sectors, such as IT Services, FMCG & Pharmaceuticals.
Subscribe to this portfolio @ Rs 3599/ 6m
Investments in securities markets are subject to market risks. Read all the related documents carefully before investing. Registration granted by SEBI, membership of BASL and certification from NISM in no way guarantee performance of the intermediary or provide any assurance of returns to investors.
Credits
Featured image: Image by brgfx on Freepik