

This article analyses historical returns on various asset classes in India over past 39 years, starting 1981 through 2019. Asset classes studied are Stocks, Gold & Fixed Deposits (FD).
It is generally understood that investments in stocks tend to provide better returns compared to other asset classes over long term. There is a lot of study available in public domain to substantiate this claim. However, most of these studies are based on US or European markets, and as such, objective data on comparative returns of various assets in the Indian market is hard to find. This article presents a study of historical returns on asset classes in India over the past 37 years and tries to provide objective data in terms of relative performance.
Historical returns on asset classes in the US
*Jeremy J Siegel, in his classic book ‘Stocks for the Long Run’[2], presents the following chart to illustrate historical returns on various asset classes in US for the past 210 years since 1802. He calls this chart to be the most important chart in the entire book, where he traces year by year wealth accumulated by a hypothetical investor who put one dollar each in: 1. Stocks, 2. Long Term Government Bonds, 3. US Treasury Bills, 4. Gold and 5. US currency. Returns include income distributed from investments (if any), plus capital gains or losses, measured in constant purchasing power and plotted on logarithmic scale.
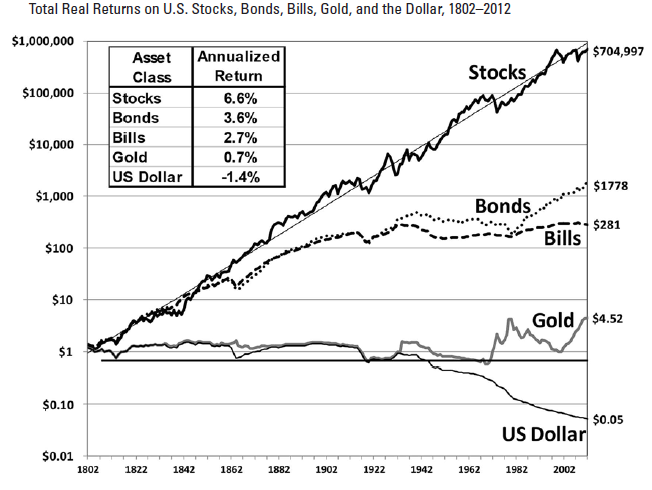
Source: Jeremy J Siegel, Stocks for the Long Run[2]
There are 2 key takeaways from this phenomenal chart. The first one is given. Stocks outperform any other asset class over long term by a very wide margin. The second observation however is far less obvious and therefore more intriguing. The consistency of returns offed by stocks at constant purchasing power (i.e. when adjusted for inflation) is far more stable when compared to any other asset class over long term.
With these insights from the US markets in backdrop, let’s look at the numbers in context of Indian markets.
Data sources used and methodology adopted for the study
For the purpose of our study, following asset classes have been considered: 1. Stocks, 2. Fixed Deposits (before and after tax) and 3. Gold.
BSE Sensex (available from 1979) has been used to represent stock index. Dividend data for BSE Sensex is available 1998 onwards, prior to that, we have approximated annual dividend yield for Sensex as average of subsequent period. Average price of Gold in Mumbai, as available with RBI, (which in turn is based on Bombay Bullion Association & PTI upto 1999-2000 and Economic Times & London Bullion Market Association from 2000-2001 onwards) is used a source of data for Gold. FD rates are based on commercial bank deposit rates for 5 years & above, as available with RBI. For those years where interest rates offered by commercial banks were spread over a range, the highest rate offered by banks has been selected, for e.g. if the FD rates spread over 12.50 – 13% for 5+ years, 13% return has been picked to represent pre-tax FD returns for that year. Tax rate has been considered at 25%, when adjusted for tax.
For inflation adjustment, 2 potential sources have been considered. CBDT cost index (used to index capital gains) is available from 1981. And IMF average consumer price index (CPI) which is available from 1980. The CBDT index is less aggressive and more commonly used for capital gain calculation, and same has been adopted for inflation adjustments in this study.
Period of study has been 1981 – date, extending 39 years, which covers the common period when data is available from all the identified sources.
Historical returns on asset classes in India
Fig-1 represents wealth accumulated by a hypothetical investor who put Re-1 each on FD, Gold and Stocks in 1981. As of 2019, nominal value of that one-rupee investment before adjusting for inflation would be as follows:
FD post-tax 14.18 (Pre Tax Rs 32.96), Gold Rs 30.39 and Stocks Rs 466.92.

Fig-1,
Comparison of wealth (nominal) accumulated by investing one rupee in 1981, on various asset classes over a period of 39 years in India
CAGR returns (nominal)
FD Pre Tax 9.38%
FD Post Tax 7.04%
Gold 9.15%
Sensex 17.07%
Fig-2, represents the same data at constant purchasing power, when adjusted for inflation. Real value of one rupee at the end of 39 years, invested over the selected asset classes would be:
FD After Tax: Rs 1.19 (Pre-Tax: Rs 2.76), Gold Rs 2.55, Stocks (BSE Sensex): 39.14

Fig-2,
Comparison of wealth (real), accumulated by investing one rupee in 1981, on various asset classes over a period of 39 years in India, at constant purchasing power
CAGR Returns (real)
FD Pre Tax 2.64%
FD Post Tax 0.44%
Gold 2.43%
Stocks 9.86%
Over a period of 39 years, at constant purchasing power, stocks provide close to 40x returns on the initial capital, Gold offers slightly over 2x return over the same period, and FD barely manages to beat inflation.
Conclusion
First of all, above data re-establishes the obvious: stocks are by far the best asset class to invest in over long periods. If we see the pre and post inflation adjusted data, this is particularly true in India due to high inflation rate. Fixed Deposits and Gold that are considered safe haven by many Indians offer pathetic returns, and may not be considered as an investment option for long term wealth creation in India.
References
1. Indians prefer fixed deposits to equities, MFs for investment: SEBI Survey
2. Jeremy J Siegel, Stocks for the Long Run. The definitive guide to financial market returns and long term investment strategies, McGraw Hill, 2014, pp 6.