As we move into the second half of 2018, this note takes a moment to introspect on key market events of H1 and review investment strategy for the rest of the year.
Looking back at H1 2018
2018 started with the indices near all-time-high and by end of H1, Sensex had added another 5%. This however, wasn’t representative of the broader market sentiments. While the large-caps represented by BSE Sensex gained, midcaps saw deep correction, and small-caps moved into bear territory from peak levels
At individual stock level the picture was even worse, with around 60% of the stocks down by more than 20% YTD, while only 15% gained in the past 6 months.
Making sense of the carnage
Experts were at pains to explain the carnage as well as the divergence. Theories included LTCG tax, US monetary policies, trade war, rupee depreciation, crude prices, political uncertainties, ASM inclusion, corporate governance concerns, interest rates, Mutual Fund reclassification, among others! With so many answers, small investors are more confused than ever!
Some of these correlations, such as those with crude price & interest rates are perhaps a bit overdone, as data suggests, one of strongest bull-run in recent history that lasted between 2003-2007 coincided a period when both crude prices and interest rates were inching up.
Historical crude price and interest rates in India, source: Trade Economics
Mutual Fund portfolio churn due to SEBI reclassification was largely complete by mid-May when the mid & small cap segments cracked. And since the imposition of LTCG coincided with a global equity market correction, the joke doing the rounds was, Indian budget has crashed the world market – we have finally arrived 🙂
So what caused the carnage in mid & small caps?
While the various reasons cited above may have contributed to certain extent, the primary reasons, are probably two. One, the mid & small cap space had become overvalued relative of largecaps following the significant run-up in 2017 – that is getting readjusted now. Second, in the process, a segment of stocks may have got over-corrected due to Fear.
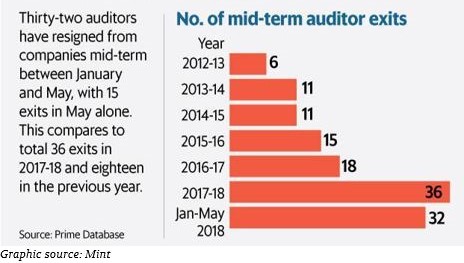
Markets go up in euphoria and go down in fear. And part of the fear is not without reason. First 5 months of 2018 saw a staggering 32midterm auditor resignations. This is aside from the increase in audit qualifications. Stocks of companies facing auditor resignations, such as Vakrangee (down 85%), Manpasand (down 65%) have understandably taken a beating. Rumour mills are abuzz with speculation and fear mongering have pulled quality stocks down as well along with the trash.
This too shall pass…
The obvious questions asked by small investors are: how long the pain is going last and how deep the cuts will be.
If we look at past 15 years data, there has been around 8 major corrections in the Indian equity markets.
- These 8 major corrections lasted for period of 160-170 days on average. Given that we are around 40 days into the present correction, data suggests pain could extend well into beginning of next CY
- Average correction in the mid & small cap space has been around 25-30% excluding 2008. Going solely by average data, another 5-10% drop cannot be ruled out
- However, if we additionally take into account the gains from the previous rise, as well as lack of participation of the large-cap index in this correction, then the probability of further cuts reduce
In conclusion, data suggests, further time-wise correction likely to continue, while pricewise correction may or may not extend by another 5-10%.
With 60% of the market in bear territory, excellent companies are available at throw away price and at valuations not seen in many years. If we could only control our fears, and focus on careful stock-picking, the rewards in the long run could be, in Ben Grahams words, ‘quite satisfactory’! 🙂
P.S. Do you have a different view or comment? Please share your perspective.
PPS. For specific investment ideas please subscribe to research & advisory services online.
PPPS. Research reports are now available online instantly on sign-up (no more emails). Check the ‘Free Zone’ for sample reports.
PPPPS. For questions or clarifications, please check the FAQ section. For unanswered questions, please write to contact@viniyogindia.com.


I like this blog its a master peace ! Glad I found this on google .