

ULIP and Endowment Policies are a combination of insurance and investment products. A good number of people have ended up committing reasonable amount of money in these products. This is despite the fact that both ULIPs and Endowment Policies offer poor investment returns and inadequate insurance cover.
In this article, we try to explain why we feel that it is advisable to invest in combination of mutual funds/ stocks + term insurance as opposed to an ULIP or Endowment Policy
Before we begin, quick introduction to the traditional insurance products might useful to those not familiar with the terminologies.
Traditional Insurance Products
Term plans
A term plan is a pure insurance product – it gives you life cover, with no maturity or interim benefits. If you die within the cover period, your family gets the benefits, else you suck your thumbs. Most people consider it to be a suckers policy (in reality it isn’t) and don’t buy it. Agents also don’t feel enthusiastic about selling these, as they have the least commission.
Endowments
In comes endowments! An endowment plan offers you life cover, charges you higher premiums than a term plan, and gives you a maturity benefit. So if you survive the term, you will still receive some amount of money as a maturity benefit, unlike in the case of a term plan. It also offers you bonuses along the way, paid out as an accumulated lump sum on maturity if you survive the term. Over a 20 year tenure, your endowment plan, if you include bonuses, could yield you up to 8% per annum.
Money back
A money back policy is nothing but a dressed up endowment plan.
While an endowment plan will give you a maturity benefit on surviving the entire term, a money back policy pays out for every few years of survival. If for example you take a 20 year money back policy, you will get some proportion (say 25%) of your Sum Assured every few years, say every 5 years. You will also get your remaining Sum Assured plus accumulated bonuses, on surviving the entire term.
Yield on a money back policy sometimes comes to a little more than yield on an endowment policy, considering that once you get the interim pay outs, you can invest them on the spot.
ULIP
Like endowments, ULIPs are a combination of insurance and investment products. While endowments offer guaranteed benefits in the form of sum-assured, ULIPs are market linked (invest in stock or bond markets) and therefore offer variable, but potentially higher returns.
Comparative returns
Endowments & ULIPs offer sub-optimal combination of insurance and investment products.
Below table compares 3 possible investment options – buying a ULIP, buying an endowment plan, and buying a term plan + equity mutual fund. The table illustrates what kind of returns you would get on each in the last 10 years (based on historical data). For the sake of parity and returns, we considered the best performing products from each category.

Source: Value Research Online
As you see from the above table, the 3rd option is far more superior both as insurance as well as an investment product. Firstly, in the third option, you get an insurance coverage that is ten times more (50 lakhs) than that of an ULIP. Secondly, the return is significantly better in the third option. So, the verdict seems quite clear.
ULIPs and tax benefits
Ever since the LTCG tax was announced in the Budget, insurance companies have been busy highlighting the tax-free nature of ULIPs. This is a compelling sales pitch, which has been influencing customers, although the underlying arguments are flawed.
Agents hard-selling ULIPs for fat commissions sometimes present an oversimplified version of the tax benefits story. For example, assuming similar return of 15% both for MF and ULIP, agents argue that the effective return on MF will be 12.5% after deducting 10% LTCG against 15% for ULIPs which is tax free. This is not true. Let’s examine why.
Costs in ULIPs
Unlike mutual funds, where all the costs are packed in one total expense ratio (TER)—which is levied evenly over the years and is reflected in the net asset value (NAV)—costs in ULIPs are front-loaded and come under different costs heads. Its premium allocation charge is a straight deduction from the premium you pay. The remaining money is invested and the other costs are deducted from this. Fund management charge, which is capped at 1.35% of the fund value, is reflected in the net asset value (NAV); but mortality costs and policy administration costs are deducted typically by cancelling the units.
While IRDA has set the net reduction in yield (RIY) for ULIPs with term <= 10 years at 3% and > 10 years at 2.25% max at maturity, this yield does not include mortality charges, policy admin charges. Additionally, premium allocation charges are front ended – so it is not even considered for NAV calculation. If you add all the charges together then the total cost becomes considerable and it generally offsets benefits from tax deduction.
Example
A sample illustration of various ULIP charges are shown below. Additionally, we assume Fund Management charges of 1.35% for ULIP and 2.25% TER for MF
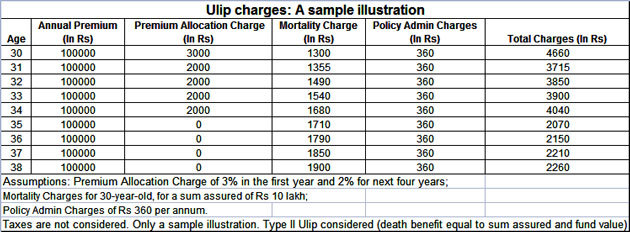
Let’s assume, we have an ULIP and a Mutual Fund invested 100 rupees in same stocks. The gross return on the stocks for a particular year is 15%.
Effective return for Mutual Fund:
Net returns in the hand of customers = Gross returns – TER = 15 – 2.25 = 12.75
Effective MF return after adjusting for LTCG = 11.475
Effective return for ULIP:
For ULIPs, the cost component varies from year to year. For illustration, we will take only those 2 years when the costs were minimum and maximum
When costs was minimum (at 35):
Net returns = 15 – 1.35 (Fund Management) – 2.07 = 11.58
When costs was maximum (at 30)
Net return = 97*0.15 – 3 – 1.35 – 1.66 = 8.54
(Explanation: since premium allocation charge of 3% is front ended, effectively 97 rupees gets invested. Assuming 15% returns, we have 97*1.15 = 111.55 gross. Deducting 1.35% Fund Management charges & 1.66% mortality + policy admin charges, we have 108.54 rupees, net return of 8.54%)
So, the effective returns for ULIP will vary between 8.54 to 11.58 rupees a year, against 11.475 for Mutual Funds.
As evident, ULIPs tend to be quite expensive compared to Mutual Funds even after adjusting for LTCG. Even for the years when the charges are minimal, costs tend to be comparable to Mutual Funds.
(And since investment advisors often charge significantly less than mutual funds, adopting investment advisor + direct stocks strategy is likely to be the most cost efficient)
Problem with relying on NAVs in ULIP
Agents often compare MF with ULIPs based on changes in NAV. This does not portray accurate picture. With Mutual Funds if you buy 100 units of a fund, you will retain the same number of units (in your portfolio) till the day you sell. That is not the case in ULIPs as certain charges such as Mortality charges and Policy admin charges are paid by cancelling units. Essentially, number of units reduce with time, which is why 15% CAGR on NAV does not translate to 15% CAGR in your ULIP portfolio
Of course, most of the cancelled units are used to buy the insurance cover – as mortality charges are nothing but life insurance premiums. But as we showed before, buying term insurance directly + mutual funds offer a better and more cost effective alternative.
Why do people still buy ULIP or Endowment Policy?
According to ValueResearch, there are 3 primary reasons, and you might agree with at least one of the reasons.
- A lot of Indians buy insurance in haste and that too for the sole purpose of saving tax, without fully understanding these products.
- Often the insurance agent is a neighbour, or a friend or, even worse, a relative. It’s kind of difficult to turn them down. So, we end up buying an endowment or an ULIP without giving it much thought. Also, these policies are pushed hard by agents as they involve attractive commissions.
- Many people see insurance as an useless expense. Hence they think it’s better to buy a product that will give some return as well. Just like they fail to see the effect of inflation, they fail to see the sub-optimal returns from these products.
Conclusion
ULIP and Endowment Policies offer poor returns and inadequate insurance cover.
Yet, aggressive marketing inspired by higher commissions, limited understanding of these products by investors and sometimes deliberate mis-selling has led to their popularity.
Combination of term insurance and mutual funds (or direct equity + advisory) can offer superior returns and more comprehensive insurance coverage.
Our recommendation is that you go with this combination instead of wasting money on ULIP and endowment policies going forward.
If you enjoyed reading this article, feel free to comment and share.